Classify Simple Emulsions
Background
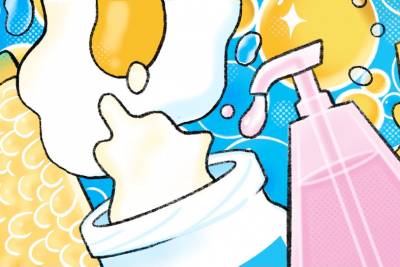
One way to classify emulsions is by identifying the continuous and dispersed phase of the emulsion. Continuous phase is the liquid in which another liquid is dispersed. In other words, it is the dominant phase in the emulsion. Dispersed phase is the opposite. It is the liquid that is dispersed within the continuous phase and which therefore occupies a relatively small space in the emulsion compared to the continuous phase.
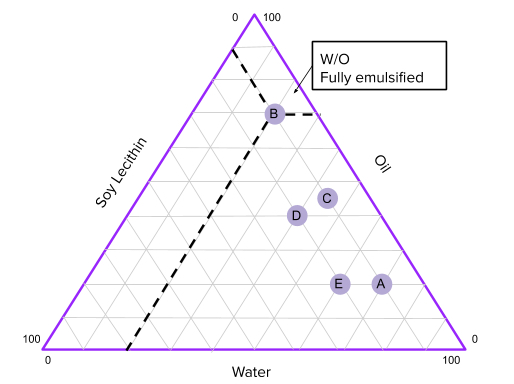
Based on this method of classification there are three major types of emulsions: O/W(Oil in Water), W/O(Water in Oil), and bicontinuous (where both water and oil have equal share in the emulsion). In this experiment, we will create different emulsions and observe what physical characteristics they exhibit and whether or not there is a more stable way to form an emulsion, that is, so that the emulsion stays emulsified for a long time without separating. After that, we will plot the characteristics on the phase diagram to estimate what ratios of water,oil, and surfactant will create the most stable emulsion.
Materials
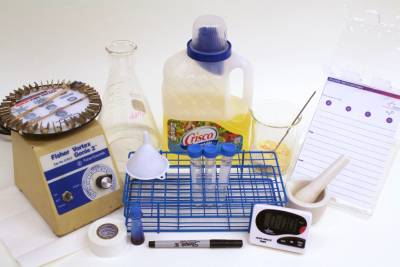
Equipment
- Scale
- A stick to scrape off residue
- Mortar and pestle
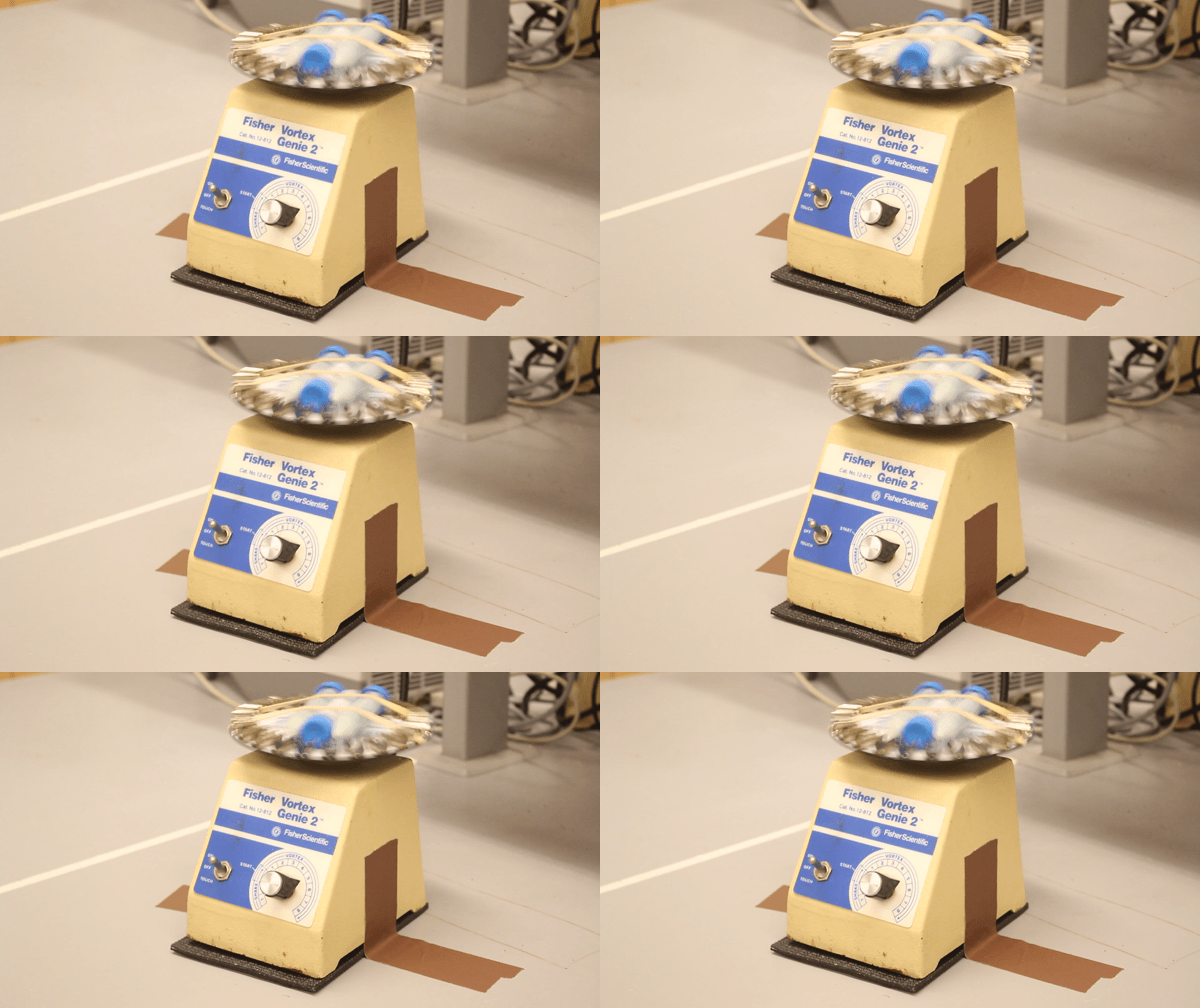
- Vortex
- Rubber band
- Labels and pens
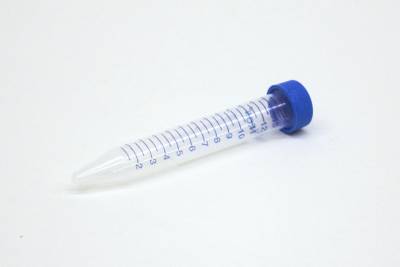
Consumables
- Capped plastic or glass tubes
- Weigh boats
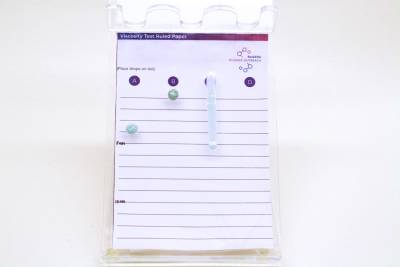
Printables
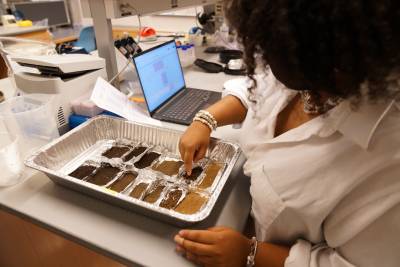
Viscosity Test Paper (consistometer paper), emulsion observation table, and emulsion phase diagrams are provided in the download section on the right.
Procedure
You will begin to make emulsions based on the following ratios using the protocol that follows.
However, feel free to choose additional points from the phase diagram to characterize. Phase diagram can be found in the download section.
For a shorter version of this procedure, look in the Downloads section.
Sample Ratios
Experiment Protocol (To make a single sample)
- Prepare a tube with blue cap.
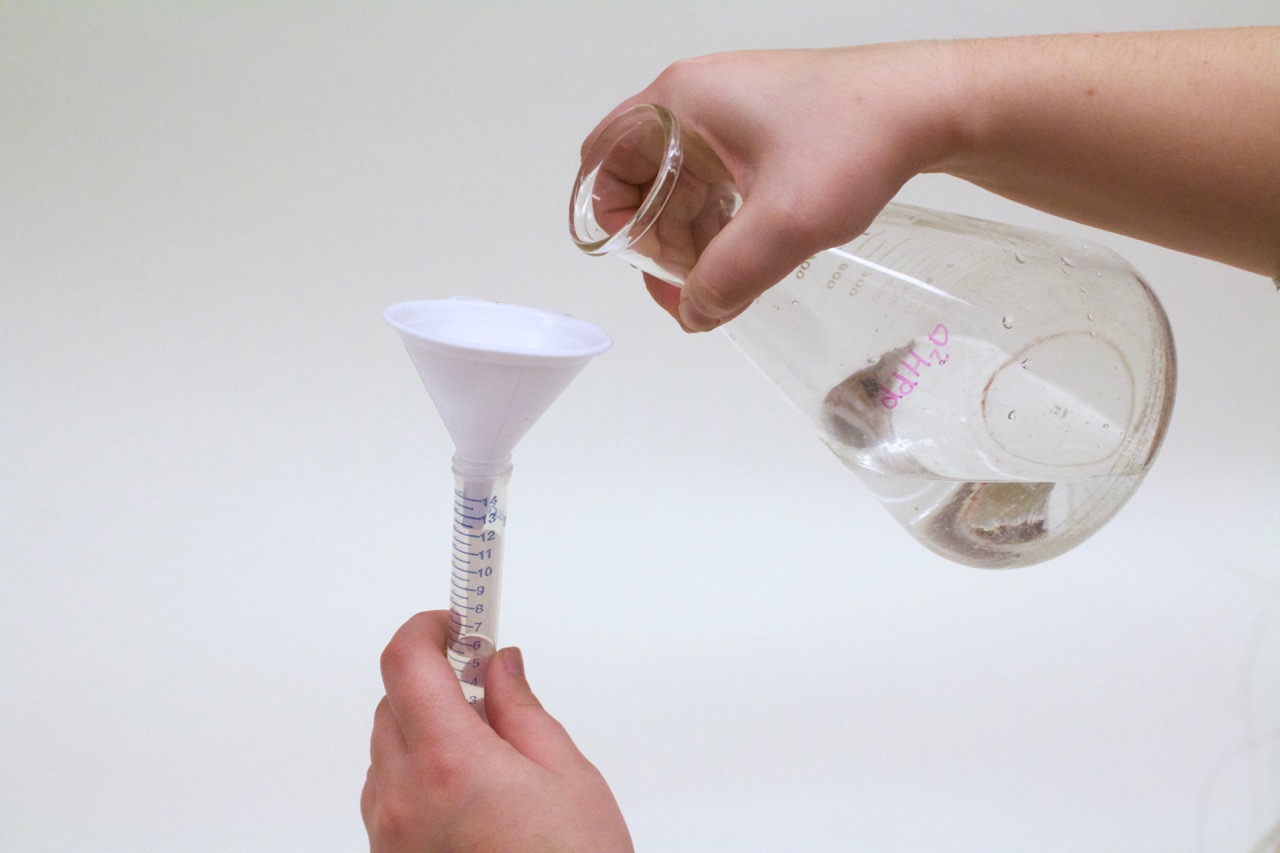
- Weigh out water according to the ratios above and pour into tube.
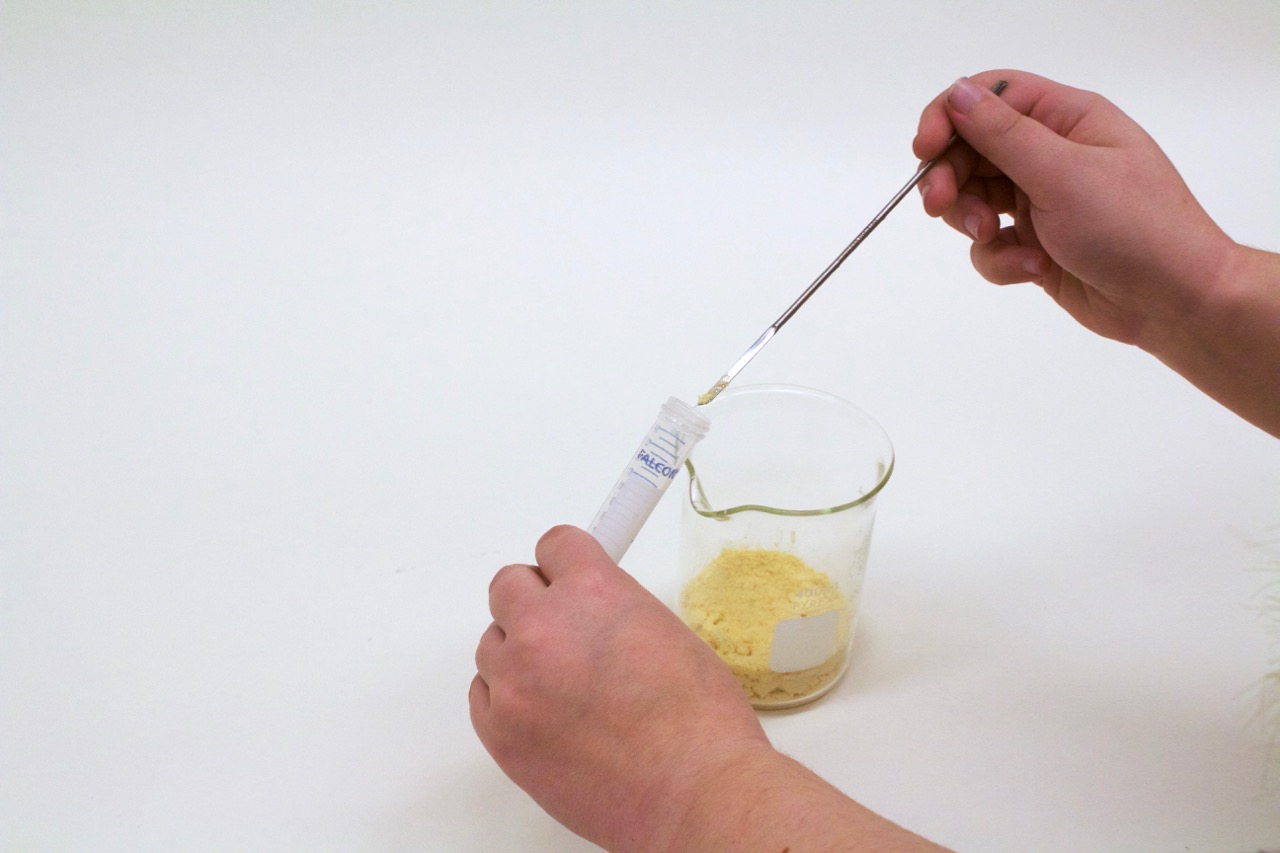
- Weigh out soy lecithin* according to the ratios above and pour into tube.
-
if soy lecithin is chunky use mortar and pestle to grind it thoroughly, but not smudging it onto the mortar, before putting it in.
-
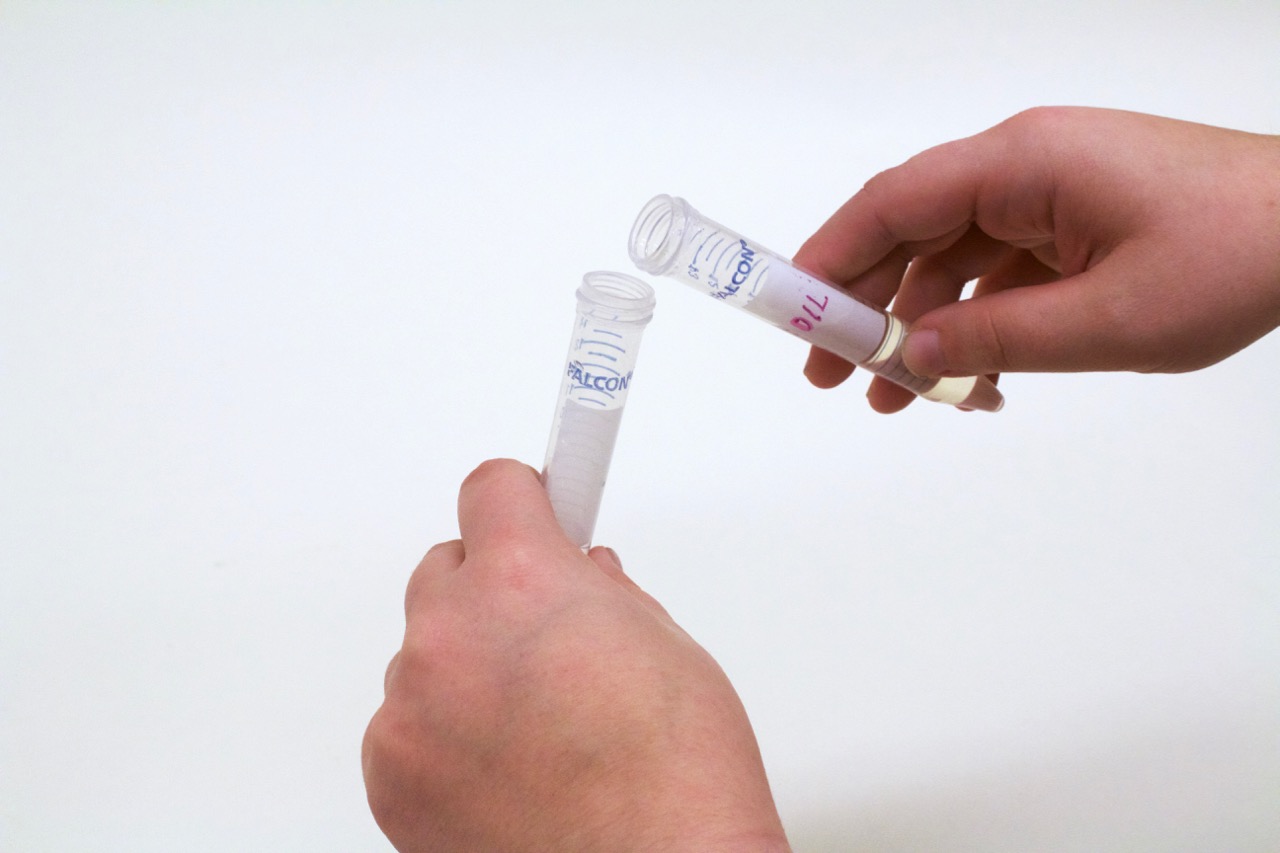
- Invert tube 2-3 times and vortex tube for three minutes at level 8.
-
If there are still undissolved soy lecithin particles, vortex a bit more, and use probing stick to manually break particles.
-
- Weigh out oil according to the ratios above and pour into tube. (Volume can also be used, but weight may be more accurate for viscous solutions like oil.)
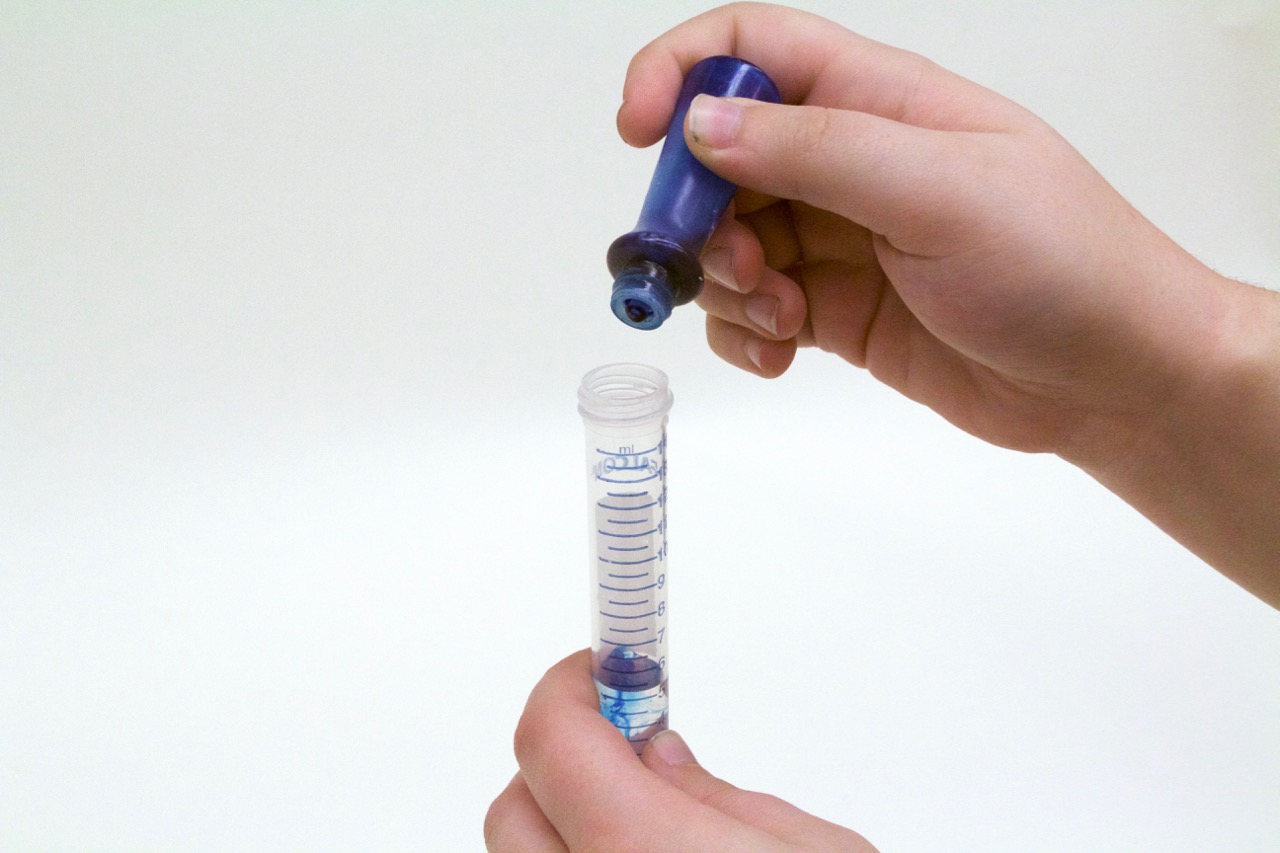
- Put one drop of food coloring in the tube.
- Vortex tube for five minutes until the color is uniformly distributed.
- Record the following characteristics in the Emulsion Observation Table (found in Downloads) immediately after vortex, 30 minutes after the vortex, and two hours after the vortex.
- Emulsion state (can you see chunks of undissolved soy lecithin, or is the liquid uniformly emulsified?)
- Volume (read off of the tube)
- Color (optional Dye Test found in Main Classifying Emulsions Lab Downloadable)
- Texture (by eye)
- Viscosity (see below)
- Record other observations or add your own metrics for characterizing your emulsions.
Supplementary: Dye Test & Viscosity Test
Click here to access the Dye Test protocol.
Click here to access the Viscosity Test protocol.
Analysis & Reflection
- After collecting data on several emulsion concentrations over a few time points, analyze your data by comparing all of your data. Which metrics best show differences in emulsification between samples? Which metrics are most meaningful? Which metrics are easiest to compare/graph/etc.?
- Graph your points on the Emulsion Phase Diagram sheet … What can you say about the concentrations of stable emulsions from your data so far? Which concentrations would you try next and why?
- What would you change about this experiment to get more information about your emulsions? What else would you like to be able to learn about emulsions?


