Viral RNA Hunters
Viral Hunters Overview
In this activity, we’ll hunt down viral RNAs in samples of lung tissue from COVID-19 patients and figure out which genes in the SARS-CoV-2 genome they came from. Then we’ll make graphs of the data and add in information about the patients to see if there are relationships between clinical features of the patients and the viral RNAs that were found. Your materials and the tools in our toolbox are all digital for this activity.
Here are the files & web-based tools required for hunting viral RNA:.

RNA Sequence Files
We have isolated the SARS-CoV-2 RNAs found in patient lung tissue. View this file here.

UCSC Genome Browser
The University of California Santa Cruz (UCSC) Genomics Institute has a terrific web-based tool to explore genomes, called the Genome Browser.


Why should we link virus biology with human disease?

Source: Vega Asensio, CC BY-SA 4.0, via Wikimedia Commons
SARS-CoV-2, the virus that causes COVID-19, is an RNA virus. The genome of SARS-CoV-2 is about 30,000 nucleotides long and encodes a variety of proteins required for its lifecycle. When someone’s cells are infected by the SARS-CoV-2 virus, the viral RNA genome is released into the cytoplasm of host cells. Here, the host cell machinery will act upon the viral RNA to make new copies for packing into new virus particles, and to make proteins. Some of these proteins help the host cells to make new viruses, whereas other proteins become the new viruses themselves. A terrific visual overview of this process can be found in this NY Times article.
When scientists work to solve a biological problem of any scale, it is critical to collect enough data to make sound, contextual conclusions. As our global society lives through the COVID-19 pandemic, we can all appreciate what it was like going from “an unknown flu-like virus” in March of 2020 to TWO (!) vaccines approved for emergency use by the FDA in December 2020. This was the result of countless hours of observations and explorations around coronavirus biology, and how it behaves in us humans.
There is still much to learn about Sars-CoV-2 and the impacts of COVID-19, elevating the importance of persistence while in pursuit of knowing. By hunting for viral RNAs in COVID-19 patient samples, we can get a glimpse into the life cycle of the virus. This information can tell us more about how the virus life cycle connects to the clinical features we see in COVID-19 patients, allowing for the creation of more effective and efficient therapies and preventions for overcoming this pandemic.
The Sars-CoV-2 Life Cycle & the Development of COVID-19
Caryn Hale, PhD, postdoc in the Darnell lab at Rockefeller University, provides an accessible overview to connect Sars-CoV-2 biology with the development of COVID-19 — the disease caused by the Sars-CoV-2 virus.
Let's Hunt Down Viral RNA Sequences
When scientists look for RNA sequences, they first use chemical procedures to extract RNAs from tissue and cell samples. However, freshly extracted RNA is usually too long for sequencing so scientists have to cut down the RNA into smaller pieces (20-200 nucleotides long). After these tiny fragments are sequenced, we get files that contain the nucleotide sequence for every small RNA fragment that was found in the sample. Now it is the job of the scientist (ok, and some computational algorithms) to figure out where each fragment maps on the SARS-CoV-2 virus genome.
To paint a complete picture for what is happening once SARS-CoV-2 infects specific tissue and cell types, we will need to understand the structure-function relationship between the SARS-CoV-2 genes found in these samples, and the proteins they encode. The purpose of this exercise is to better understand how the viral RNA sequences found in the tissues of COVID-19 patients can give us detailed molecular insights into how SARS-CoV-2 infection might impact cellular and tissue health.
It is helpful to become familiar with the SARS-CoV-2 genome architecture (i.e. how the genes are organized on the RNA strand), as well as the role of the proteins encoded by these RNA genes. The following image is a good representation of this concept:
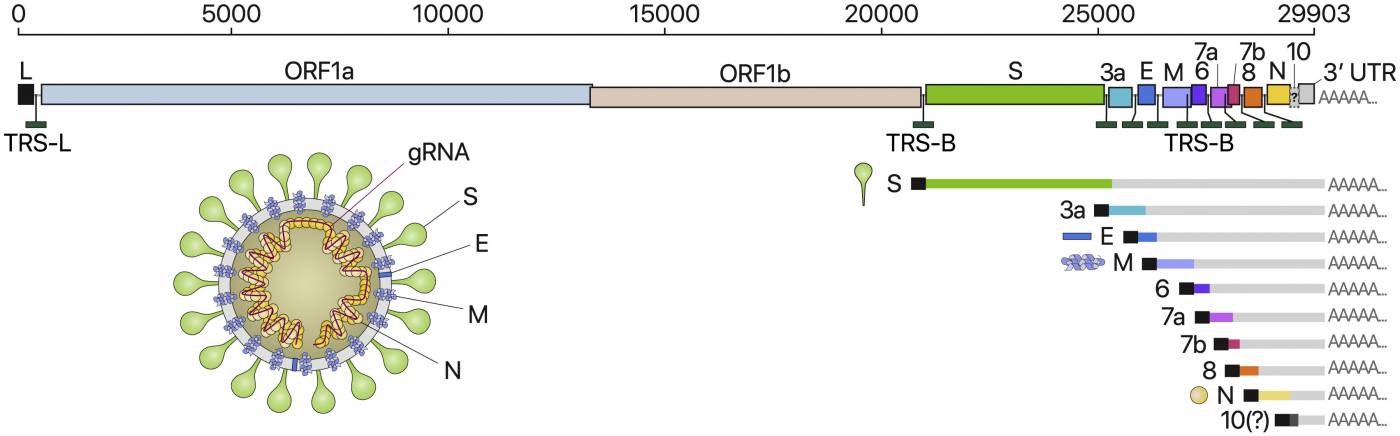
The genomic architecture of Sars-CoV-2 (or, where the virus genes map on the virus RNA, and how this relates to particle structure). Source: https://doi.org/10.1016/j.cell.2020.04.011.
Activity Overview
We will explore a public dataset, originally described in this peer-reviewed research paper (you can also download a PDF of this paper by going to the Save & Share menu). More specifically, we are going to look at the RNAs from the same lung samples that were examined in this study. While the researchers of this study also looked at human RNAs, we are going to ignore all of the human RNAs and just isolate the SARS-CoV-2 RNAs.
Part 1: Hunting Down the Viral mRNA Reads
We have already prepared the sequences for you, which means that we isolated the RNAs from the SARS-CoV-2 genome from the rest of the RNAs in the samples. We used Galaxy, a freely available web-based tool (https://usegalaxy.org), to retrieve the data and hunt down the viral RNAs in lung tissues. If you’re curious, here are the steps we took to find the viral RNAs:
- First, we download all of the RNA sequences that were found in the patient sample from the SRA database.
- We looked for sequences that came from humans. To do that, we compare the RNAs that we found with the human genome. If they match, we consider them human sequences.
- In this case, we’re interested in the sequences that do NOT match the human genome, so we removed all the sequences that map to the human genome, and isolate the sequences of RNAs that don’t match.
- We now take all of the sequences that were found in the lung samples that weren’t human and compare them with the SARS-coV-2 genome.
- Now we have a list of all of the sequences found in the lung sample that match any part of the SARS-coV-2 genome.
As mentioned above, these steps have already been performed. You can find and make a copy of the resulting files here. When you open the files, you’ll see something that looks like this:
>123456
ATCGAGAGCGTGCAGTCCTAGTCAACACTGCAC
The first line is the name of the sequence (just a string of numbers), and the second line is the sequence itself. There are quite a few sequences in this file.
Part 2: Learning How to Use the UCSC Genome Browser
We’ll use the UCSC genome browser (UCSC Genome Browser Home), which is a powerful web-based tool for visualizing full genomes of lots of different organisms. There is a tool built into the UCSC genome browser called BLAT, which searches for short sequences in the genome that you’re focusing on. When we BLAT our sequences from the lung samples, we are looking to see if that sequence exists in the SARS-CoV-2 genome. BLAT can only accept 25 sequences at a time, so you may have to do several batches if there are more than 25 sequences in a certain batch.
Here’s a short tutorial on how to use UCSC genome browsers:
You’ll want to keep track of how many reads match to each gene of the SARS-CoV-2 genome for each sample. It might be easier to do this with pen and paper, or you can do it electronically. It is designed to help keep track of the numbers — this is especially useful for samples where you need to do multiple batches. (This tracker is also linked in our materials list above.) You don’t need to do all the sequences for all of the samples, but the more you do, the more interesting the data will look.
Part 3: Entering and Visualizing the Data
Once you have the total number of RNAs that map to each gene for all of the samples that you want to analyze, you can enter the data into the data visualization sheet. Caryn leads a tutorial on what this should look like in the following video:
To show an example here, we’ve added the data for the first sample, SRR11921221 in the spreadsheet template here.
If you didn’t do all the samples, that’s no problem. Just enter the data for the samples that you did analyze. Next, take a look at the charts that are included in the Google Sheet. The three charts are all from the same data (your data!), but shown in three different ways.
The first graph (“by sample”) plots the number of reads from each gene. The color of the bars indicate which sample the reads came from. Ask yourself these questions:
Which genes have the most reads?
Do all the samples that you analyzed have a similar distribution of reads?
The second graph (“by Tissue Type”) has grouped the samples according to which portion of the lungs the samples came from. To see which samples came from which parts of the lung, look at the “Tissue” column. Ask yourself these questions:
Do the different tissues types have similar distribution of reads from the different viral genes?
Are there any types of tissues that look different from all the others?
The third graph (“by Gender”) has grouped the samples according to whether the samples came from males or females. This information is in the “Gender” column. Ask yourself these questions:
Are there more samples from males or females?
Do males and females seem to have different distributions of viral RNAs?
Take it Further!
We’ve given other information about the patients that the lung samples came from. See the columns for the age of the patients, if they had a cough, if they had COPD and whether they had diabetes (for these, 1 means yes, 0 means no). Try to group based on these variables and make plots yourself.
Do you see any variables that seem to lead to different distributions of viral RNAs?
References and Additional Resources
UCSC Genome Browser: Check out the UCSC YouTube channel, which has lots of videos about how to use the browser.
Bad News Wrapped In Protein: Inside the Coronavirus Genome:NY Times article by Carl Zimmer and Jonathan Corum