Data Visualization and COVID-19
What is data visualization and why is it important?
Data visualization, also known as “dataviz,” is the graphical representation of information derived from data. Dataviz is particularly useful in the age of “big” data — large and complex datasets that are too unruly for traditional methods of analysis. By showcasing the patterns and outliers through visual means, we can more easily generate conclusions and actions that best address the questions surrounding these datasets. In this video, Rockefeller graduate fellow takes us through the basics of dataviz, and how it relates to the SARS-CoV-2 pandemic.
The Challenges of COVID-19 Dataviz
Communicating uncertainty is HARD! In just over a year, our world went from learning about a flu-like outbreak in Wuhan, China to creating vaccines against the well-characterized SARS-CoV-2 virus. The amount of scientific information and data generated during this time is unprecedented, and creating data visualizations that reflect the evolving nature of what we know about virus spread has been complicated. In this video, Caitlin discusses the successes and pitfalls of COVID-19 dataviz communications, and highlights several examples of how folks got it right.
COVID-19 DataViz Takeaways
Throughout the chaos and hardships of the COVID-19 pandemic, we have consistently sought out any narratives and information to help us understand how the virus affects our lives. Many, from epidemiologists to physicians to politicians, have sought to shape this onslaught of data into clear narratives. Visualizations allow us to make sense of this mess of data quickly, making them a powerful tool with which to push these narratives, whether that is done in good or bad faith. Here are Caitlin’s takeaways for responsibly tracking the spread of COVID-19 while addressing the pitfalls and limitations inherent in dataviz about a pandemic.
Check out these other resources
General Data Visualization Resources
- From Data to Viz
- The Data Visualization Catalogue
- Visualizing Data
- Flowing Data
- Policy Viz
- Color Theory in Data Viz
COVID-19 Data Visualization Resources
- Washington Post: “Coronavirus Simulator”
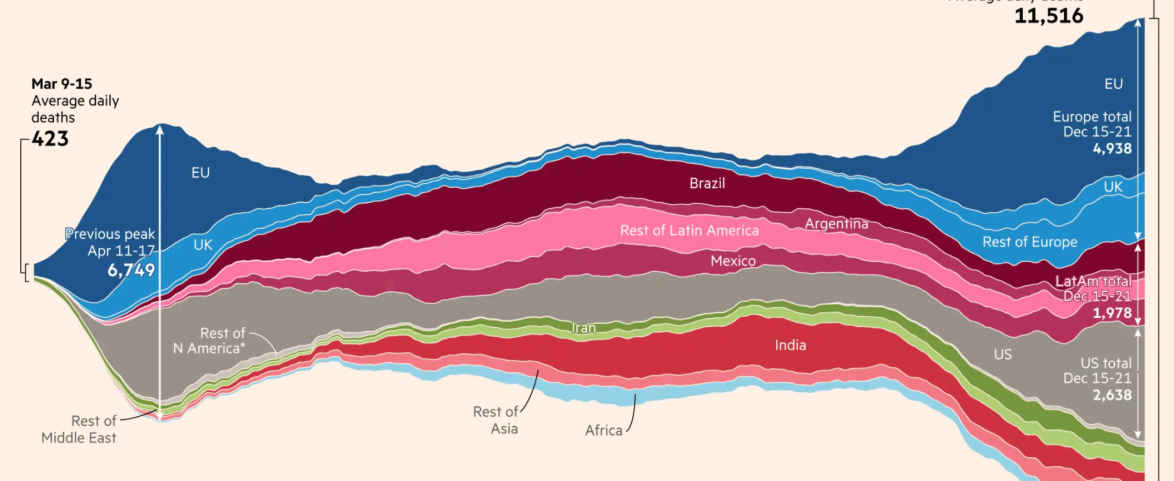
- Financial Times: “Coronavirus Tracker“
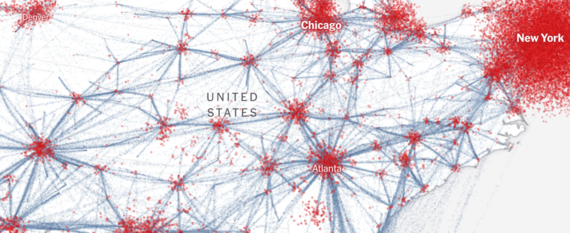
- The New York Times Data/Graphics Team: “How the Virus Got Out” “How the Virus Won”
- Shirley Wu: “People of the Pandemic“
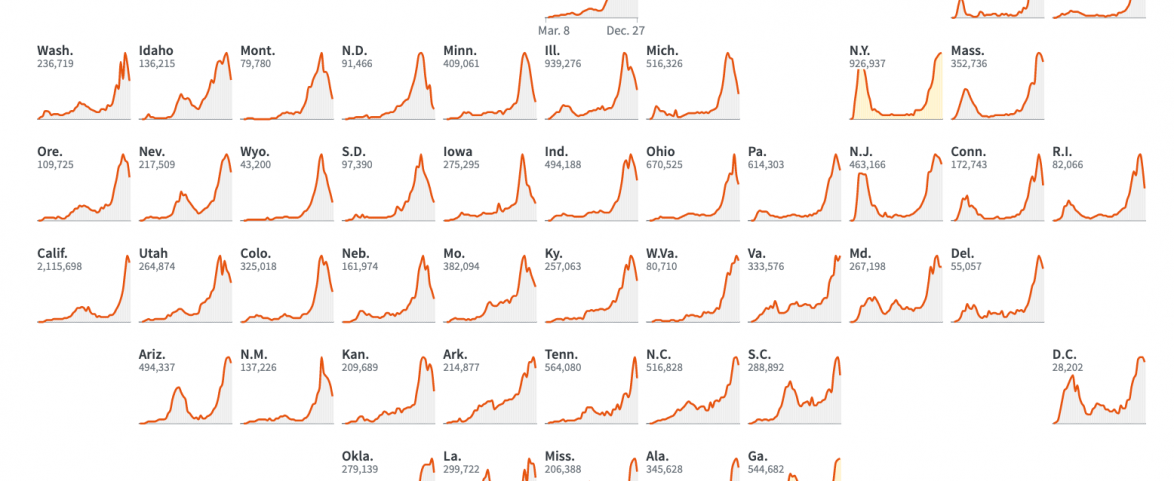
- Reuters Graphics Team: “The Pace of Death” “Where US Coronavirus Cases are Rising and Falling” “The Korean Clusters”
- FiveThirtyEight: “A Comic Strip Tour Of The Wild World Of Pandemic Modeling”
- El País: “A room, a bar, and a classroom: How the Coronavirus is Spread Through The Air”