East River metatranscriptomics
The analysis in this computational activity allow you to explore the microbes detected as well as what we can learn about eRNA stability and the impact of filtration in these water samples.
Introduction
In this explore module, we’ll compare the microbial composition of water samples from the East River, collected just by the Rockefeller University (RU) campus in New York City. These water samples were collected on July 5, 2021 in anticipation of receiving student samples for Rockefeller’s Summer Science Research Program (SSRPv; v for virtual, since this occurred during the COVID-19 pandemic).
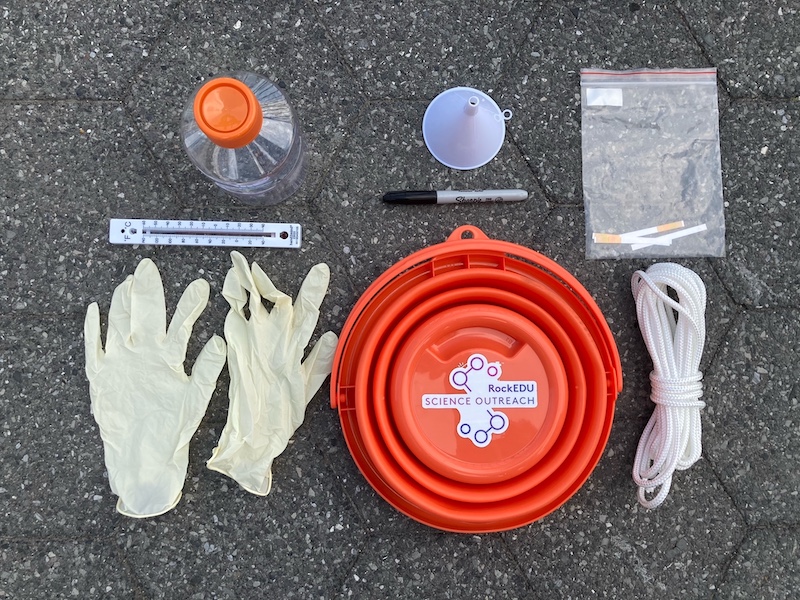
The supplies used to collect water samples, including gloves, a thermometer, a sterile plastic bottle with orange cap, a funnel, a sharpie, an orange bucket, pH strips, and a long white rope.
Since students from across the country would be sending samples to RU, we wanted to control for the amount of time water samples would spend in transit. We reasoned that because RNA is so short lived, it was likely that the RNA composition could change once a sample was taken from its environment and shipped to us. To mimic this transit time, we took two samples from the East River and kept one (called “roomtemp”) for 2 days at room temperature to mimic mailing, before freezing it. The other sample, called “frozen”, was placed in a freezer immediately after the sample was taken from the river.
Next, both samples underwent the same isolation procedure at the same time to get RNA. Each sample was passed through a filter to trap bacteria and single-cell eukaryotes, and from the flowthrough we isolated RNA which was expected to contain viruses (Figure 1).
RNA from both samples was used to make sequencing libraries and then processed using CZID to get taxon level microbial composition. So in total, we have 4 samples we’ll be comparing:
| Sample | Condition |
| Frozen | filter |
| Frozen | flowthrough |
| Roomtemp | filter |
| Roomtemp | flowthrough |
Let’s now explore some data. For this explore module, we’ll start by firing up R in RStudio, and retrieving the data. This module assumes some basic familiarity with R.
This project and analysis is provided by Dr. Joseph Luna as a RockEDU Fellow while working as a Postdoctoral Fellow in the Rice Lab at The Rockefeller University. Follow along with Joe as he takes you through these data and their analysis…
Materials
RStudio
Open RStudio. (Learn more here to start downloading the components for the free RStudio package if you don’t have it yet)

R script
Download the provided R script “EastRiver.Rmd” from the Save & Share menu and load it into RStudio. Run each section and read the comments to walk through the analysis with Joe.
Protocol
- Run each step of the script, reading the comments and viewing the displayed outputs as you go.
The cursor in the lower right corner is ready to press the green arrow to “Run Current Chunk.” Run each section of the script and read Joe’s notes along the way to follow along.
- Once you get to line 160, now it’s your turn to step in and do your own analysis of the data.
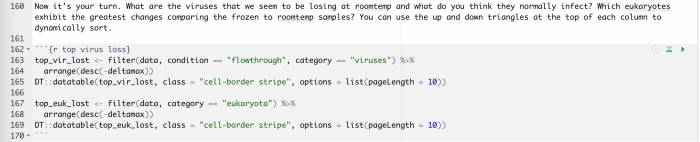
After line 160, you can generate a data table for your own analysis and exploration. What will you find?
- After going through these analyses, feel free to modify the analysis to ask related questions, graph a particular subset of these data, etc. Where does your curiosity take you?
Note: even if you cannot run the R script yourself, you can jump ahead to looking at the final output tables as csv files available in the Save & Share menu.
Exploration
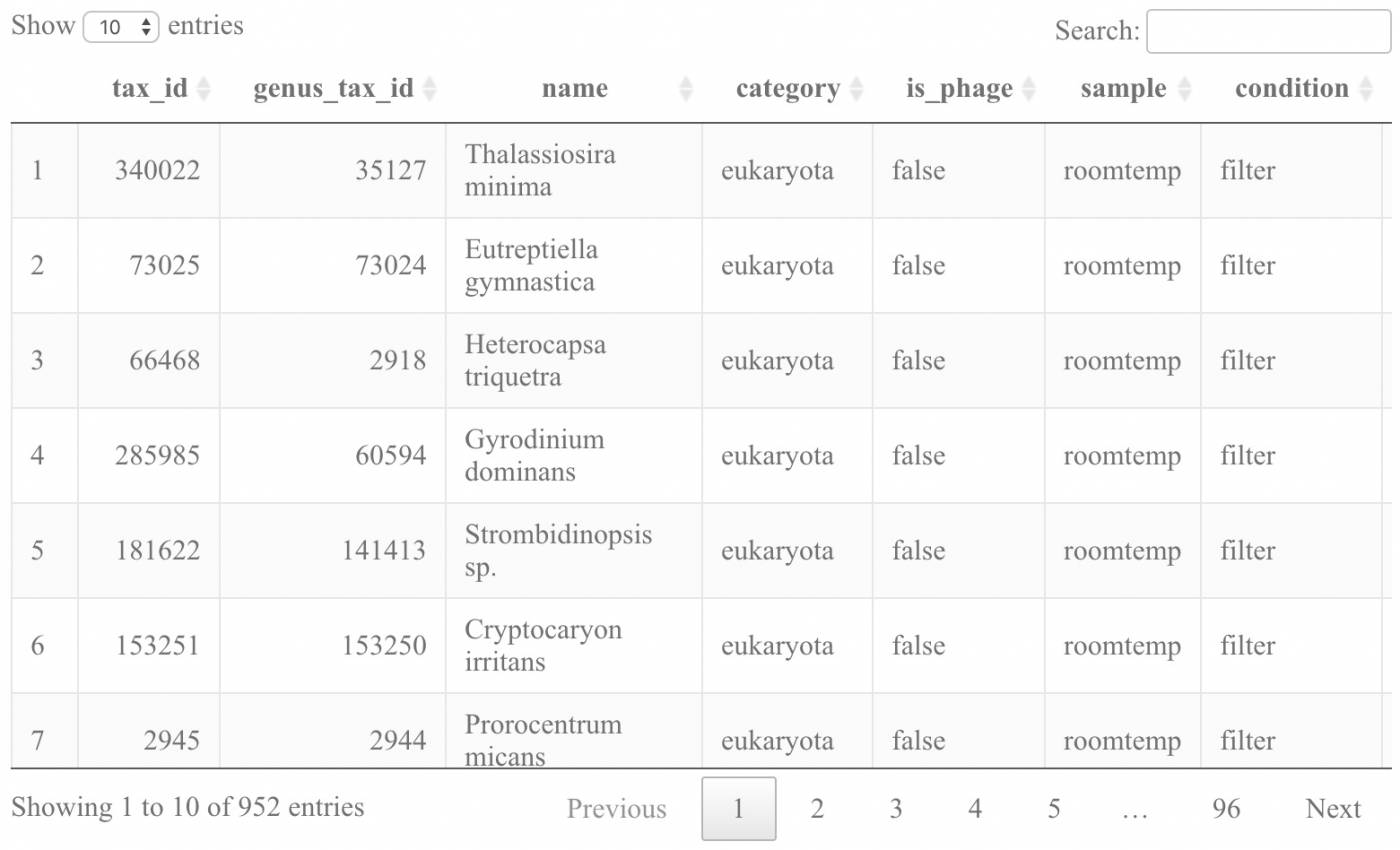
As you look at the table of species most lost from the Roomtemp samples (as generated from running the script; a snapshot of which is shown below), consider some of the following questions:
What are the viruses that we seem to be losing at roomtemp and what do you think they normally infect?
Which eukaryotes exhibit the greatest changes comparing the frozen to roomtemp samples?


")
")