Series: Community Perspectives
5 Steps To Seperate Science From Hype, No PhD Required

Editor’s Note: This is a rereleased post by scientists, Gabrielle Rabinowitz and Emily Jane Dennis. In this 2013 piece, Gabrielle and Emily explore the ways in which to evaluate the findings presented in the media. These 5 steps for “separating science from hype” apply today, possibly even more so than they did in years prior.
“Does flossing decrease my risk of heart disease?” No, but is it good for you? Yes.
“Does aluminum cause Alzheimers?” Nope.
“Should I start following the Paleo Diet?” Probably not & paleolithic people probably didn’t either.
As scientists, we’re asked these sorts of questions all the time. Although we’re trained to evaluate scientific ideas, it definitely doesn’t take a PhD to judge the latest craze or newest finding. To do it yourself, follow these 5 steps:
1. Separate the sales pitch from the science
Almost everyone is trying to sell something. In articles about science, the sales pitch is usually right in the headline. The science is harder to find.
Start by looking for a quote from a scientist. Read the quote but ignore the spin the author put on it. Don’t forget that scientists can have biases too: be skeptical of scientists who don’t acknowledge the limitations of their research and fail to present alternate explanations. Also, check to see who’s funding the research- they might have an agenda too! In short, read articles carefully and figure out if the claims they make are based on the facts they present.
2. Find the data
Some articles will go beyond quotes and actually describe the studies behind their claims. If they don’t, or if you still want to learn more, use Google Scholar to look for the original source. Search with whatever information you have: the names of the scientists, their institution, or the main topic. You’ll find some articles that are free and easy to read, but many that aren’t. Even if you can’t access or understand an article, you can still find out if the research was published in a reputable journal. Look for the ‘impact factor’ of the journal where an article was published (search for the journal name + “impact factor”). This number is only given to journals that have been around for at least three years and it reflects how often the papers in that journal have been referenced by other scientists. Look for an impact factor of 5 or higher when deciding if a journal is trustworthy.*
3. Evaluate the data
Once you find the data, it’s time to evaluate it. Check to see if the scientists behind the original claim, or another group of scientists, have repeated the experiments (and make sure the results were the same each time!). It’s also better if they analyzed hundreds or thousands of people (or monkeys, or cells, or anything else) instead of just two or three. Also keep an eye out for all the differences between two groups in a study, especially with humans. Things like income levels and access to health care can sometimes explain the reported results better than whatever the article is proposing.
Think about it this way: if you were in charge of figuring out the height of the average American male, you would need to measure a bunch of people to get it right. If you only measured a few people, and they happened to be basketball players, you’d be way off. Also keep an eye out for misleading graphs. Graphs are great for communicating complicated information quickly, but they can also be misleading. Here are a few classic graphical tricks to watch out for:
The “put two things with the same trend on one graph” trick: 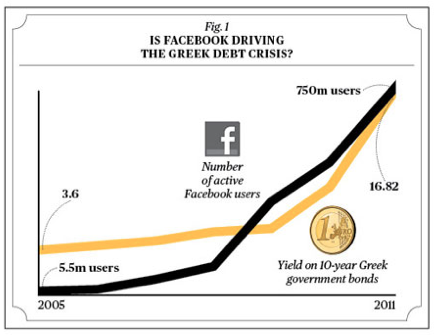
(source: Businessweek)
This one’s pretty obvious: correlation does not equal causation. It’s exaggerated, but it’s a good example of how putting two things on the same graph doesn’t mean they’re related… even if it looks like they might be.
The “take out data points” trick:
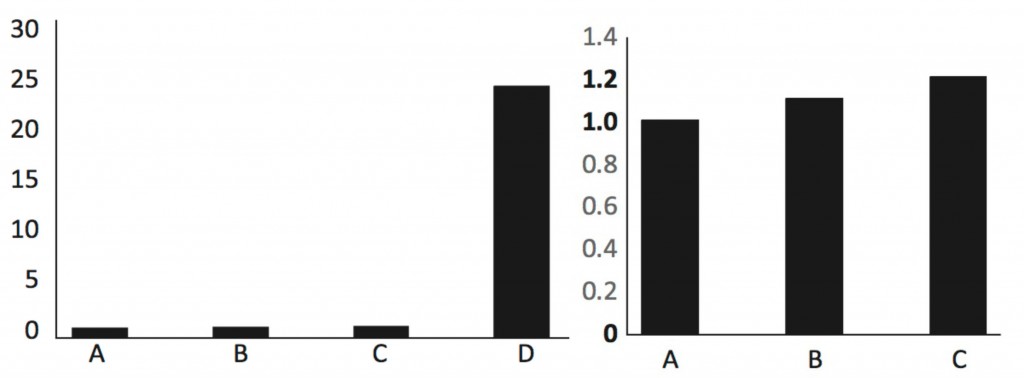
original (left) vs. doctored (right)
Here, we removed the last (very important) column that put the other columns into context. This is a great example of why you should find the original graph from the primary research article whenever you can.
The “zoom in on the axis” trick:
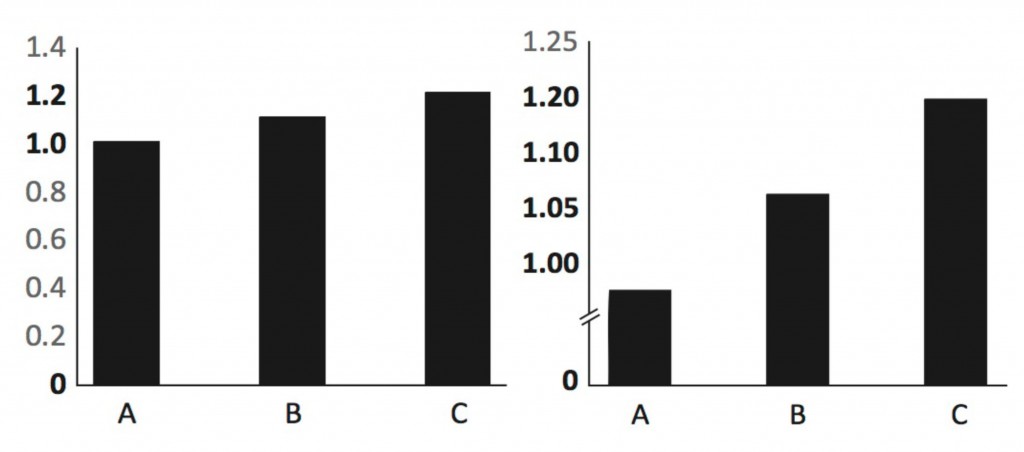
These two graphs have the same information. In the graph on the right, we’re zooming in on the top bit of information, making it seem like the differences between the columns are bigger than they are. Always check the numbers on the left side (y axis), and what those numbers stand for.
Finally, cover up the title, look at the graph and ask yourself what title you would give the data. If you don’t think you can conclude anything from the graph, you should be skeptical of anyone who claims they can. This applies to any kind of information, not just graphs!
4. Put the story into context
Now that you know what the study is saying, find out how it fits into the big picture. Make sure there’s more than one paper written about the subject and look for quotes from scientists who weren’t directly involved in the research. Different labs and researchers will often disagree about a scientific topic (which is why you should distrust the phrase “scientists say”). If you’re having trouble finding alternative perspectives, the Wikipedia page for the topic can be a good place to start, especially if it contains a “controversy” or “criticism” section.
5. Ask an expert
If after all this research and data analysis you still feel lost, find someone you trust and ask them about it! Is there a science blogger you like? Tweet at them. If you don’t have a favorite yet, ask us. We’d love to help and point you in the right direction toward solid resources. Nothing beats a real discussion (even over Twitter or email!), but you can also check out neutral, non-biased sites like Mayo Clinic.
More helpful resources:
- Google has some great tutorials on how to search. They give advice on which terms to choose and how to evaluate the search results.
- The PLoS journal series, especially PLoS Biology, is an open source, peer-reviewed journal series. All the articles are free, and many are written clearly, so read away!
- PubMed is another search engine for science journal articles.
- This guide shows you how to convert obscure technical measurements into simple terms.
- This list of “predatory” journals is a good guide to what not to trust. These journals will publish any research for a hefty price. They have no quality control.
- This list of 10 Questions you should ask to distinguish real from fake science is a great way to decide whether or not to trust a source.
- The UK National Health Service runs an excellent fact-checking website that can help you look behind the headlines.
- Here’s a great article detailing some of the biases and pitfalls in data analysis, especially for small studies.
Useful links from the comments (thanks guys!):
- For even more open access journals check out the Directory of Open Access Journals (DOAJ).
- For physics papers, you might have better luck over at arXiv, which archives reprints. Make sure the article has been “accepted for publication” in a journal, though!
- There’s also a preprint archive for biology papers called PeerJ Preprints.
- Pubpeer.com is a forum where peer-reviewed scientists comment on and critique recent published findings.
- This thorough post helps you tell “a good website from a crap website”.
*This threshold is most relevant to biomedical and basic biology journals. Other fields may have fewer citations, but that doesn’t mean that the research is necessarily untrustworthy. Impact factors certainly don’t tell the whole story about a journal’s value. If you want to know more, check out this article that delves into a little more detail.