Modeling, Math, and Social Mixing
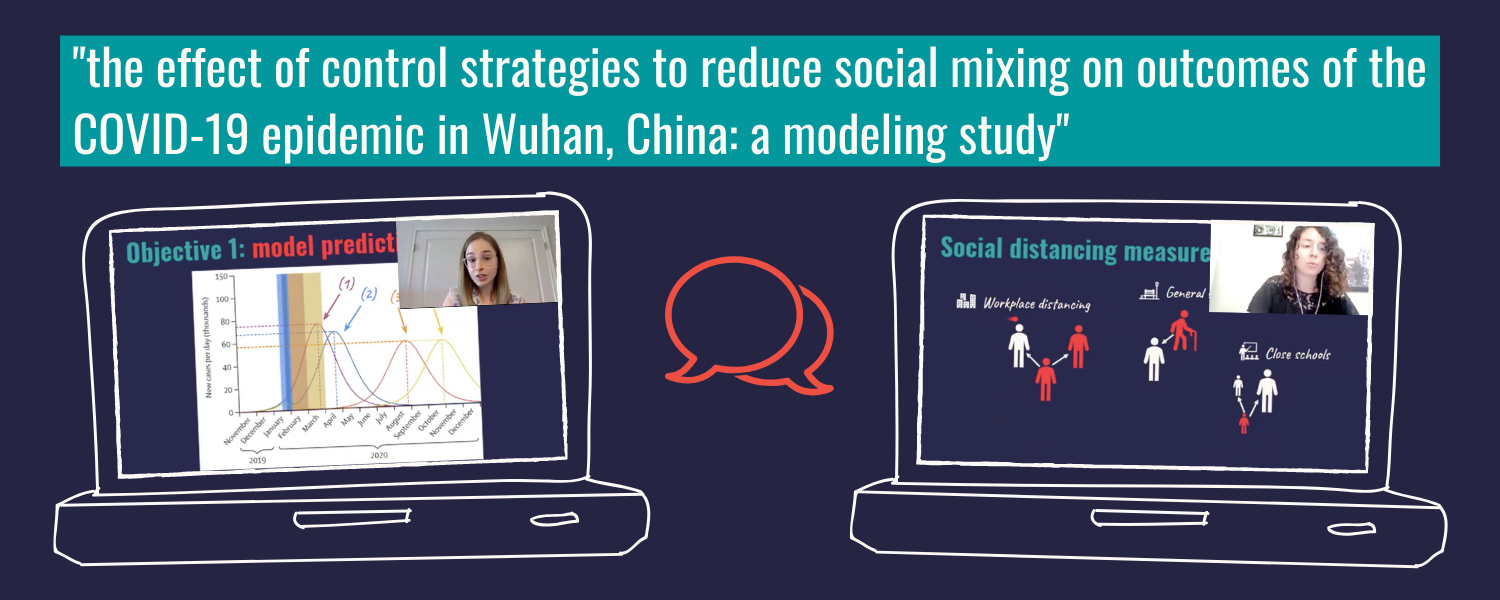
In this session of D4P, postdoctoral fellows Dr. Chloé Pasin and Dr. Sinead Morris discuss how scientists apply hypothetical modeling and math to predict the outcomes of lifting social distancing rules at various time points. Using a case study from The Lancet Public Health published on March 25, 2020, Drs. Pasin and Morris put into context disease modeling, and how the authors applied a model to predict what would happen in Wuhan, China under different scenarios of social mixing (i.e. when and how the population stops social distancing).
The styles of scientific reasoning used in this paper:

Hypothetical Modeling
the construction of analogical and/or hypothetical representations of phenomena and processes
What you need to know
The following are the key terms defined in this D4P presentation, and are important for understanding the data presented.
Latent and Infectious Periods
Picture the exact moment that someone becomes infected with a virus. It will take some time for the virus to enter their cells and to increase in numbers. While the person is infected during this time, they’re not yet infectious, meaning, they are not yet able to infect someone else. This period of time is called the latent period.
At some point after a person becomes infected with a virus, the amount of virus in their system will be high enough to allow for transmission to someone else. Once infecting other people becomes possible, this person will have entered the infectious period.
R0 & Re
R0 (pronounced “R nought” or “R zero”) stands for basic reproduction number. This represents the average number of people within a susceptible population that an infected person can infect. Essentially, R0 measures the potential for a disease to spread in a population.
For example, imagine that you’re the 1st person infected by a new pathogen, such as a virus. If the R0 value is 2, then the number of people that you will infect will be 2. Each of these people that you have infected can infect 2 new people. Those 2 new people can then infect 2 more people, and so on. R0 gives an estimation of how many people will be infected in the absence of a vaccine or social distancing measures.
While R0 describes the hypothetical spread of a disease within a susceptible population, the Re value, which stands for effective reproduction number (also known as Rt), is the measurement of disease spread that is calculated once an outbreak or pandemic is underway.
Let’s go back to the R0 = 2 example. For any new infectious disease, this would be calculated at the start of the pandemic, and makes the assumption that everyone in the population is equally susceptible to the disease. After some time has passed, we can look at the Re, which is probably lower than 2 because each person is likely infecting fewer new people. This expected decrease is due to the fact that some people have already recovered from the disease, and cannot be infected again.
R0 is determined one time at the start of the epidemic and does not change, whereas Re will change over time as the number people who have recovered changes. Re is extremely important because it helps to predict whether the disease will continue to spread.
Transmission Rate
Related to R0, the transmission rate represents the number of people that each infected person infects on each day that they are infectious. This value depends on the number of people an infected person comes into contact with each day, and the chance that each of those contacts will lead to a new infection. While R0 tells us about the infectious potential of a pathogen, the transmission rate takes human behavior into consideration. For example, even if a pathogen has a very high R0 value, the resulting disease may not spread in a population that practices social distancing or does not regularly come in contact with other people.
Simulation
Simulation describes the use of hypothetical models to make predictions, and is an approximate imitation of a particular scenario (such as COVID-19 disease spread in Wuhan, China). Simulations allow researchers to change specific variables to see what could happen. Here, researchers are simulating disease spread across a range of social distancing parameters.
About our D4P Fellows
Chloé Pasin, PhD (she/her), Postdoc @ Columbia University
Chloé is a postdoctoral research scientist at Columbia University. She has a background in mathematics and is now trying to answer concrete clinical questions in infectious disease by using biostatistics and mathematical models. She loves the collaborative aspects of her work, as it brings together people with different background and expertise (immunologists, infectious disease specialists, mathematicians…). She grew up in Toulouse, South West of France and lived in different places (Paris, Bordeaux, Australia, Seattle WA) before moving to NYC. She is currently staying home with her partner and his cat, cooking a lot and practicing more yoga!
Learn more about Chloé by visiting her website and following her on Twitter @ChloePasin.
Sinead Morris, PhD (she/her), Postdoc @ Columbia University
Sinead is a postdoctoral research scientist at Columbia University. She uses mathematical models to understand how our immune systems respond to infectious diseases such as HIV and the flu. She grew up in Glasgow, Scotland, before moving to the US in 2013 to start her PhD. It was here that she first developed an interest in using maths to understand how viruses spread through populations, and how best to control them. She is currently sheltering at home with her boyfriend and their dog, Dixie, and in her spare time is rediscovering her love of drawing.

